Evidence and data
Why this page exists
Charitable money often stops not because it disappears, but because nobody can see where it went. When delivery cannot be checked, donors give less, and they give to whoever shouts loudest rather than whoever delivers.
So we publish the evidence.
What we publish
For each stage of funded work. Every record below is published and open to checking, and none of it carries a coordinate or a child’s personal data, because neither is needed to show that the work happened.
- Dated photographs of the work, published with the location metadata removed
- Itemised receipts for expenditure
- Portions served and the dates they were served, counted and signed off by the school
- Budget against actual spend
How releases work
The work is divided into stages defined at the outset. Funds are released in stages against them. The first release is made when the project reaches its funding goal. The evidence we publish for each stage unlocks the release for the next.
That means work which has not been evidenced does not proceed to the next stage of funding.
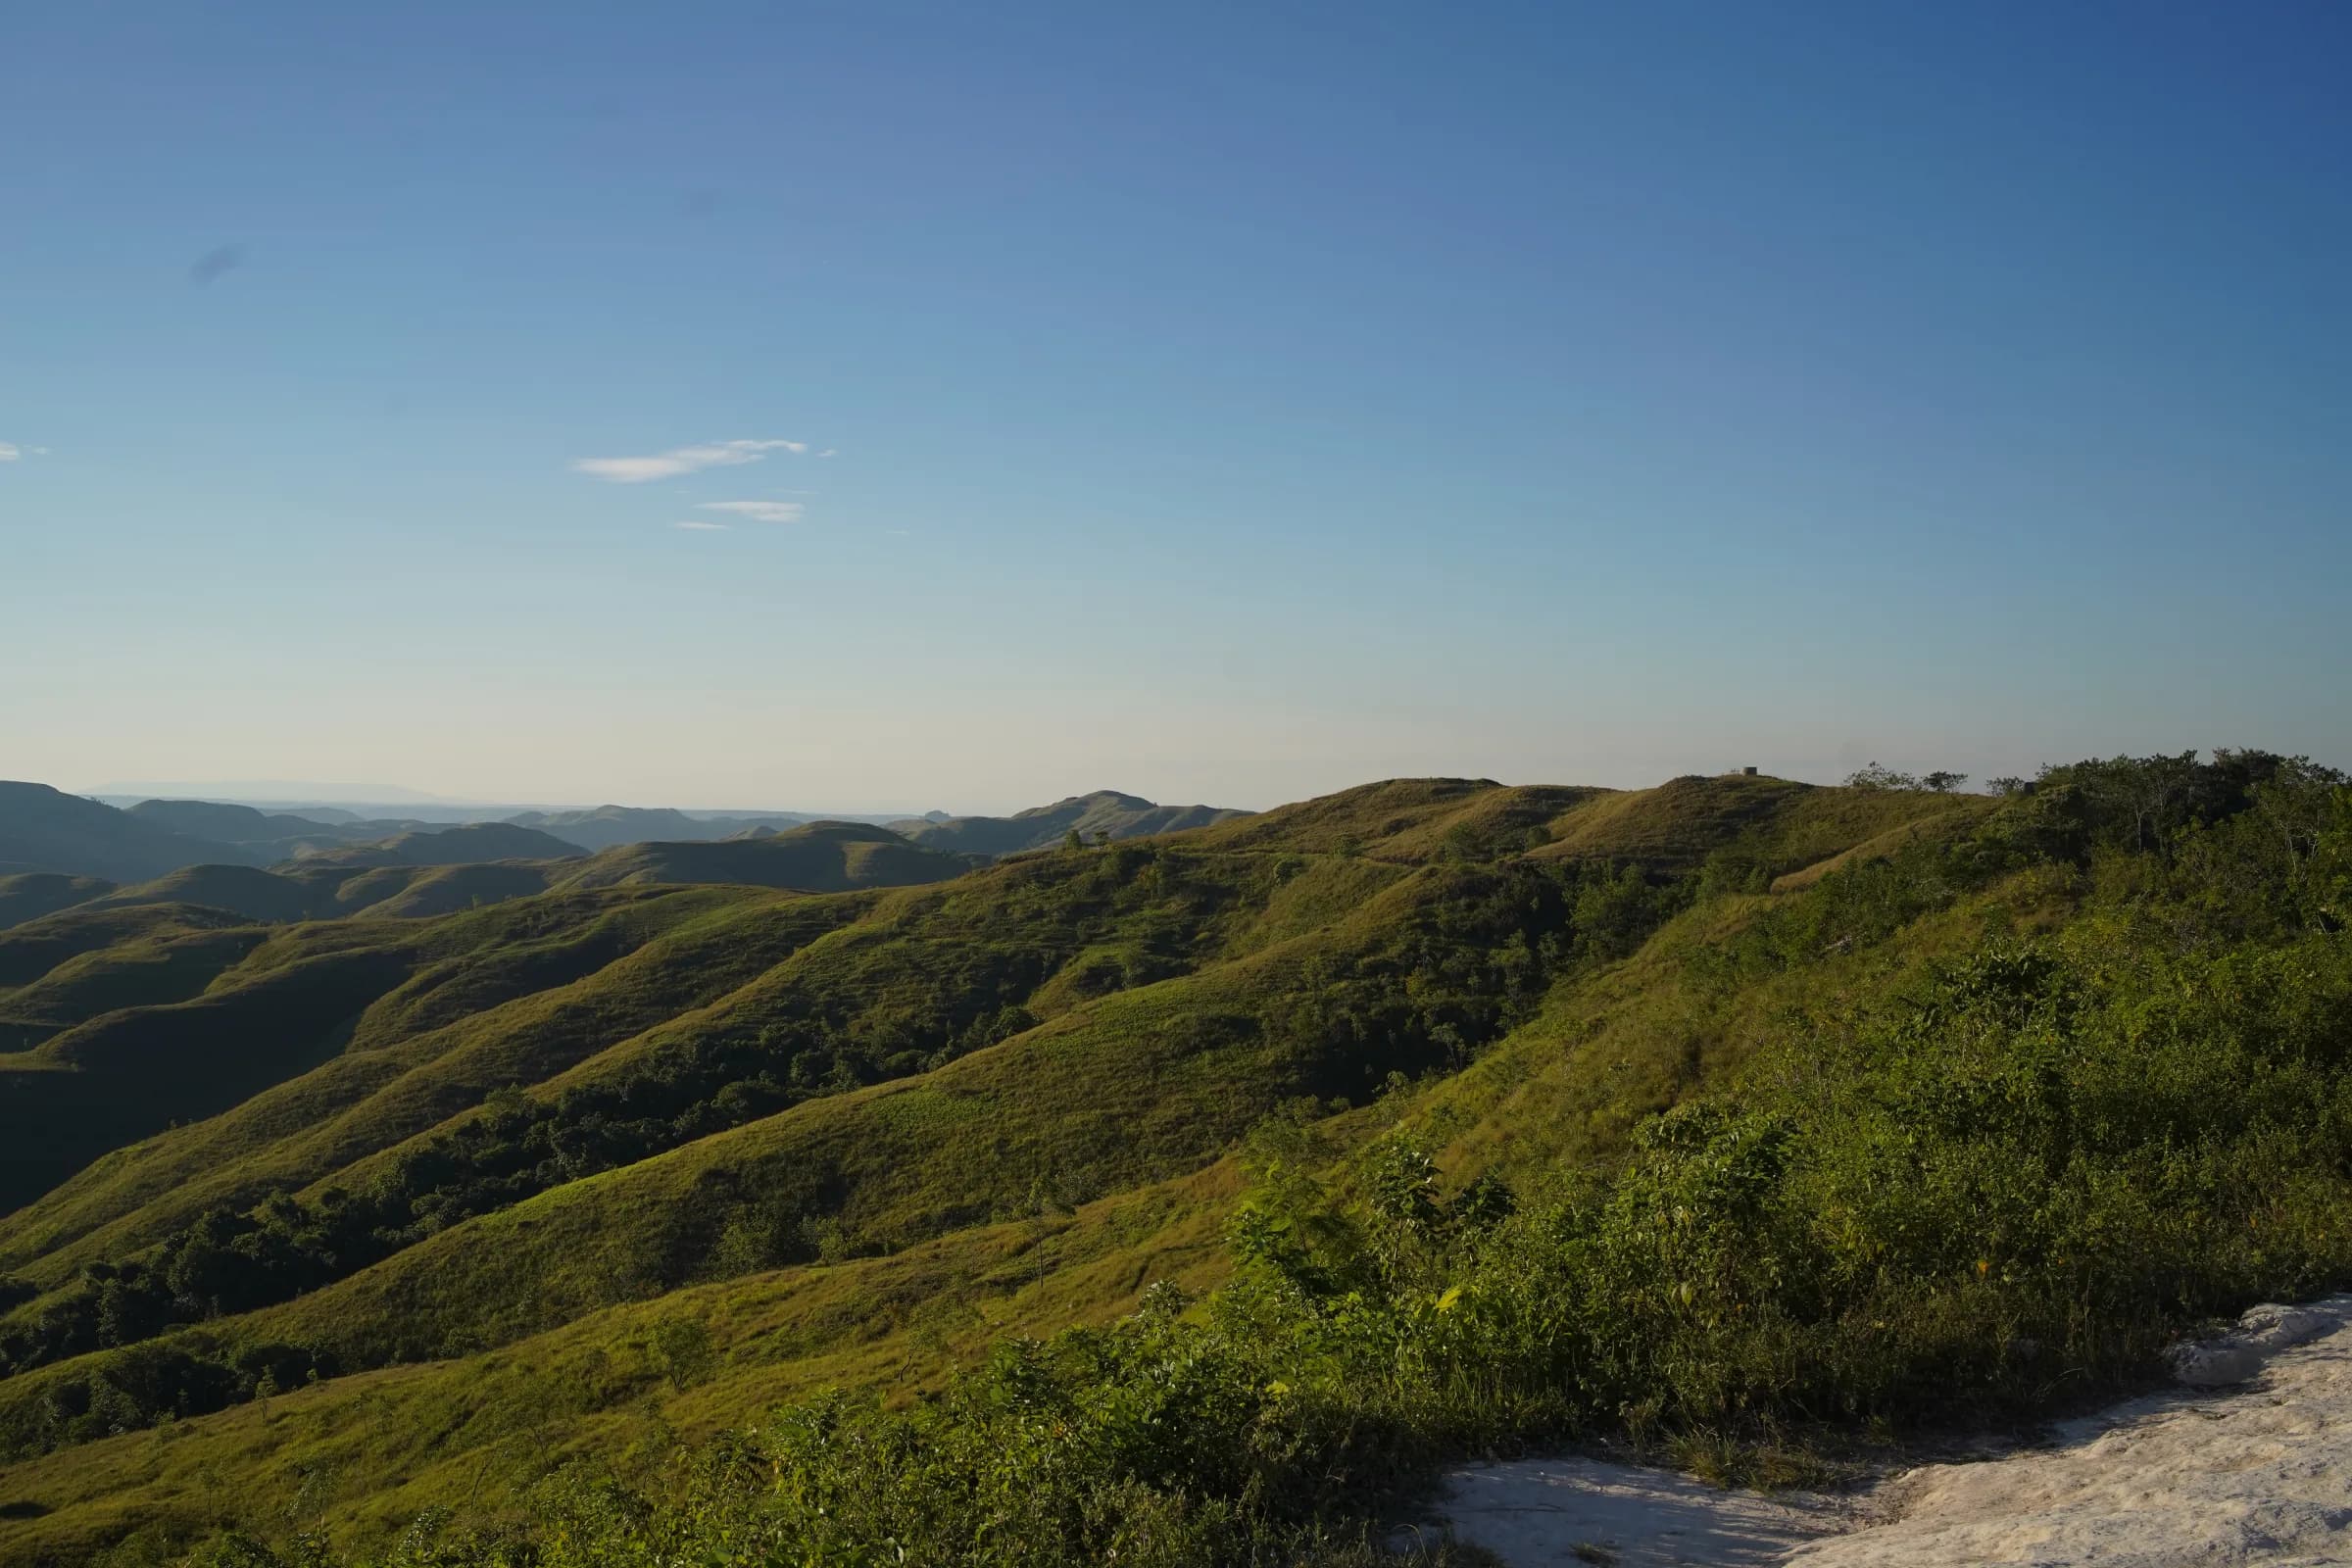
Terrain like this is what makes the six kilometre service radius the decisive measure in our siting analysis.
School survey: the aggregate analysis
We publish our own analysis of the national school registry for three sub districts in Kabupaten Sumba Timur: Nggaha Ori Angu, Kahaungu Eti and Pahunga Lodu. That is 48 state schools in all, 34 primary and 14 junior secondary. The measure running through it is a coverage one: how many schools one kitchen point could reach inside the 6 kilometre service radius the government standard uses, and how many it could not. What this shows is a coverage gap, not a judgement on anyone’s kitchen. The analysis now reaches a recommendation, and we publish it below with the case against it and with the two findings that would change it. A recommendation is not a selection: no site has been chosen, no school has been approached, no field visit has taken place, and nothing has been promised to anyone.
Headline figures
- State schools surveyed
- 48
- Reachable within 6 km
- 24
- of 41
- With confirmed grid power
- 18
- of 24
- Not reachable from any point tested
- 15
- of 41
The three sub districts compared
This table compares the three sub districts on aggregate columns only: the name of the sub district, the number of state schools, how many of those are in the distance modelling, how many sit inside the 6 kilometre service radius, and how many of the reachable ones have confirmed grid power. It contains no school, no village and no coordinate. The last column is modelled rather than counted from enrolment at every school. This table is not a list of candidate sites and not an order of preference.
| Sub district | State schools | In the modelling | Within 6 km | Of those, confirmed grid | Modelled child catchment |
|---|---|---|---|---|---|
| Nggaha Ori Angu | 14 | 14 | 8 | 5 | Roughly 1,000 to 1,300 children |
| Kahaungu Eti | 15 | 11 | 6 | 4 | Roughly 900 to 1,200 children |
| Pahunga Lodu | 19 | 16 | 10 | 9 | Roughly 2,400 to 2,600 children |
Caveat
The child catchment ranges in this table are modelled, not measured. They are calculated from the number of schools inside the service radius and from the enrolment range checked at a subset of schools, not from an enrolment count for every school. The ranges do not indicate a chosen site.
A finding from the data
Of the three sub districts surveyed, only the Pahunga Lodu catchment band reaches the scale of a single national programme kitchen unit. That is a finding from the data, not a siting decision and not a selection. No school has been approached, no school has agreed to anything, no field visit has taken place, and the siting decision is due in September 2026.
Enrolment: rounded ranges
| Category | Count |
|---|---|
| Primary schools | Roughly 50 to 150 students |
| Junior secondary schools | Roughly 100 to 500 students |
These figures were checked at 5 schools across 2 sub districts, semester 2025/2026, on the ministry public school profile service. Which schools were checked, and which sub district each figure came from, are not published. The ranges are rounded deliberately, and the measured figures are recorded nowhere.
Our recommendation, and what would change it
On the evidence in this survey we recommend Pahunga Lodu as the strongest candidate for the first kitchen, subject to the field visit: a recommendation is not a decision, and no site has been chosen.
No site has been chosen. This recommendation comes from desk analysis of a public national registry, and the siting decision is due in September 2026. No school has been approached, no school has agreed to anything, and no field visit has taken place. Nothing has been promised to anybody.
- Scale
- The modelled catchment in Pahunga Lodu is roughly 2,400 to 2,600 children, against roughly 1,000 to 1,300 in Nggaha Ori Angu and roughly 900 to 1,200 in Kahaungu Eti. The cost model published on this site is built on one SPPG standard kitchen at 3,000 portions a day, and Pahunga Lodu is the only one of the three with a catchment that could fill one. The same kitchen built in either of the others would run at roughly 40 per cent of its design capacity while the full capital cost of building it was still carried.
- Power
- Of the 10 schools inside the service radius in Pahunga Lodu, 9 have confirmed grid power in the registry, against 5 of 8 in Nggaha Ori Angu and 4 of 6 in Kahaungu Eti. Cold storage and retained samples need power that does not fail, and power is the largest unknown in the capital estimate. This is the one ground here where the risk is already largely answered rather than waiting on the field visit.
- Accreditation, and it is secondary
- Pahunga Lodu has 3 A-accredited schools in its breakdown, against 1 in Kahaungu Eti and none in Nggaha Ori Angu. This is the weakest of the three grounds and it comes last for that reason: accreditation describes a school and not a kitchen site, and on its own it would not carry a recommendation.
There is a case for Kahaungu Eti, and a reader should not have to find it unaided. Its nearest existing kitchens are 16 to 38 kilometres away, the largest separation of the three sub districts, so on unmet need alone it has the strongest claim of the three. It does not win here because the objective is a kitchen that can run at full scale, not the greatest possible distance from an existing one: on the modelling in this survey a kitchen there would run well below its design capacity for as long as it stood.
Two findings would change this recommendation. The first is the field visit finding no suitable building, or no school willing to take part. What we recommend is a sub district, and nothing in that recommendation obliges any school inside it to agree to anything. The second is the three schools in Pahunga Lodu whose coordinates are missing or corrupt in the registry, which is why its coverage figures are calculated over 16 schools rather than 19. If those three turn out to sit outside the service radius, the modelled catchment falls, and the scale ground above is the first thing to fall with it.
Each sub district in full
The same tables for each of the three sub districts: how many state schools, power, accreditation and the distance bands, with the caveats that apply to that sub district beside its own figures. Every figure quoted further up this page is here in full.
The full breakdown for each sub district
Number of schools
| Category | Nggaha Ori Angu | Kahaungu Eti | Pahunga Lodu |
|---|---|---|---|
| All state schools | 14 | 15 | 19 |
| Primary schools | 10 | 11 | 13 |
| Junior secondary schools | 4 | 4 | 6 |
| Villages covered | 8 | 8 | 7 |
Power availability
| Category | Nggaha Ori Angu, 14 of 14 | Kahaungu Eti, 11 of 15 | Pahunga Lodu, 16 of 19 |
|---|---|---|---|
| Grid (PLN), confirmed | 5 | 5 | 12 |
| Solar, confirmed | 1 | 3 | 1 |
| Recorded as none | 2 | 2 | 2 |
| Not recorded | 6 | 1 | 1 |
Accreditation
| Category | Nggaha Ori Angu, 14 of 14 | Kahaungu Eti, 11 of 15 | Pahunga Lodu, 16 of 19 |
|---|---|---|---|
| Accreditation A | 0 | 1 | 3 |
| Accreditation B | 6 | 5 | 7 |
| Accreditation C | 8 | 5 | 6 |
Distance modelling
| Category | Nggaha Ori Angu, 14 of 14 | Kahaungu Eti, 11 of 15 | Pahunga Lodu, 16 of 19 |
|---|---|---|---|
| Within 6 km | 8 | 6 | 10 |
| Within 6 km, with confirmed grid power | 5 | 4 | 9 |
| Not reachable | 4, 8 to 12 km | 5, 10 to 14 km | 6, 9 to 15 km |
Nggaha Ori Angu
Road corridor
- 8 schools within 6 km
- 2 schools, 6 to 7 km
- 4 schools, 8 to 12 km
Kitchen site, one side
Kitchen site, other side
6 km service radius
In Nggaha Ori Angu we tested four candidate kitchen points. The best point reaches 8 of the 14 schools within 6 kilometres, and five of those eight have confirmed grid power. Power supply is the single hardest cold chain constraint at a remote site.
Four schools sit 8 to 12 kilometres from every point we tested, and are not reachable from any of them. All three sub districts surveyed hold a cluster like it, 15 schools in all, and each of those needs its own answer later. We mention them precisely because this plan does not reach them.
The point in question is a modelled point. It is not a chosen site and it is not a school.
Land area
| Category | Count |
|---|---|
| Up to 10,000 m² | 7 |
| 10,001 to 50,000 m² | 5 |
| Above 50,000 m² | 2 |
Land data exists for Nggaha Ori Angu only. Kahaungu Eti and Pahunga Lodu have not been surveyed for land, and no figure for them is inferred from this one. All 14 schools in Nggaha Ori Angu have land above the 800 m² minimum for a full central kitchen, and the smallest of them by several times over, so land is not the binding constraint on where a kitchen could go. Exact areas for the smallest and largest sites are not published: a single square metre figure is unique enough in the national registry to identify one school, which is why the distribution above is given in bands.
Distance modelling
| Category | Count |
|---|---|
| 6 to 7 km | 2 |
Kahaungu Eti
Caveat
The power, accreditation and coverage breakdowns for this survey are calculated over the 11 primary schools whose coordinates are recorded in the registry, not over all 15 schools. The four junior secondary schools are not included in those breakdowns.
Pahunga Lodu
Caveat
Three schools have missing or corrupt coordinates in the registry and were excluded from the distance modelling. Coverage figures are therefore calculated over 16 schools, not 19.
Caveats that travel with this data
Caveat
- The registry distinguishes "Tidak Ada" (explicitly none) from a blank field (not recorded). A blank may mean no supply, or it may mean nobody filled it in. Only the entries counted as confirmed, meaning the PLN and the solar counts, are positively recorded in the registry. All of it must be verified on the ground before anything is decided on it.
- Distances are great circle, not road distance. Actual travel will be longer.
- The national registry does not carry enrolment. It is available on the ministry public school profile service and we have verified it for a subset of schools, not all of them. The size of the child catchment is therefore partly measured and partly still modelled.
- Enrolment is published as rounded ranges rather than exact figures, and that is deliberate. One exact figure for one school, standing beside a named sub district and an accreditation count on this page, can be matched to a single entry on the ministry public school profile service, which names that school without writing its name. Rounding closes that path. The measured figures are deliberately recorded nowhere.
Source: Kemendikdasmen national school registry, referensi.data.kemendikdasmen.go.id. Retrieved 7 August 2026.
What we can and cannot prove
The outcome we claim is one thing: a safely prepared meal, served inside a controlled time and temperature window, from a kitchen built to the national standard and sited close enough to the schools it serves to hold that window. Better attendance and better learning are what the work is aiming for, and we will publish those figures when we hold them rather than assert them now.
One kitchen at one school cannot prove an outcome at population level. What can be proved is which controls were run, the records that go with them, what it actually cost, and whether the kitchen ran every school day.
Under Law No. 27 of 2022 on Personal Data Protection, no measurement of any child, including attendance records and body measurements, is taken before written consent from a parent or guardian. Those consent forms have not yet been drafted, so no child’s data has been collected.